OzMesh

Project Info

Team Vegemite thumbnail

Team Name


Team Vegemite


Team Members


Deddy and 3 other members with unpublished profiles.

Project Description


Ozmesh is an instant, interactive mesh block statistical data visualization tool that uses NSW heat and vegetation data, ABS data and Journey To Work data to help users navigate Sydney.


Data Story


OZMesh lets you see all the mesh blocks in the whole country (but in this version, we didn't exactly do any optimization in the rendering so we had to limit it to sydney only), and visualize mesh block data such as urban heat, vegetation and population.

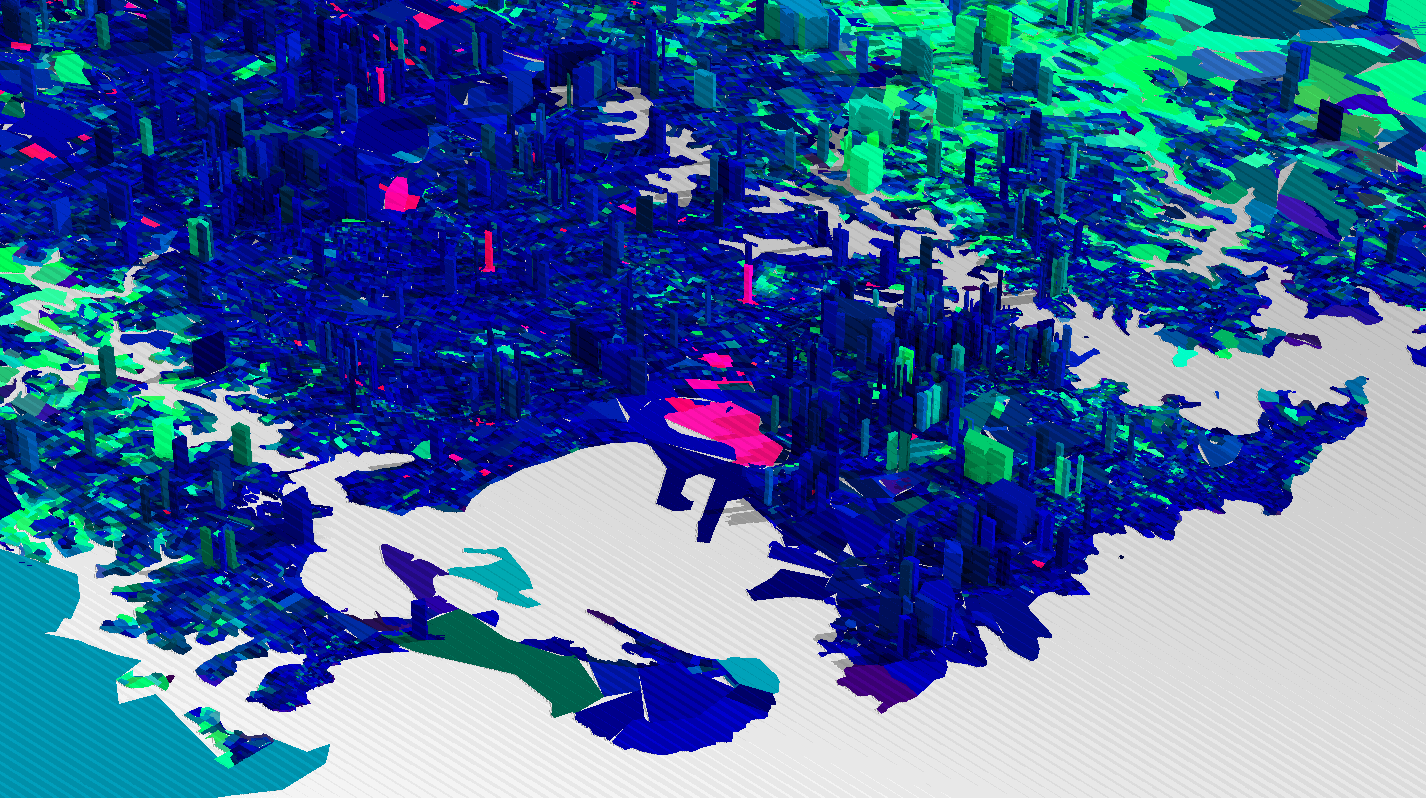
It can also visualize SA1/SA2 data. As can be seen from the screenshots (and video), you can make red/green/blue and height of the blocks, and now suddenly you can compare/contrast multiple attributes to see if there are any interesting knowledge to be gained from it.

For example, we saw that there's a pocket of urban heat in high density urban population, and there's really not that many trees around that area, as opposed to other cooler places.

We also saw that the young children (aged 0-4) years old basically only exists in suburbs with new housing developments, such as the Olympic park. As you go higher in age, you start to find people living closer to the city. Not shown in the video, but you also find older and older people towards the rural areas.

This is just in a few minutes of messing around with the tool, which took a really long time to build. Imagine what can be done when full, processed datasets are integrated into this map. You can play with data much faster with this tool than with online based tools.

We actually had to reduce the mesh map polygon size considerably, in order to render all the mesh blocks on screen at once. This was actually the hardest part and took the longest time, but fortunately we managed to get it done.


Evidence of Work

Video

Homepage

Project Image

Team DataSets

ABS - Census

Data Set

Journey To Work

Data Set

NSW Urban Vegetation Cover to Modified Mesh Block 2016

Data Set

NSW Urban Heat Island to Modified Mesh Block 2016

Data Set

Challenge Entries

Ultimo: what are the building blocks of an innovative precinct?

What makes an innovative precinct? With huge infrastructural developments in the Ultimo community changing the way people live, work and play in and around the Ultimo area, how might we more accurately predict what the precinct will need in the future to ensure it is a hub for innovation, creativity and entrepreneurship?

Go to Challenge | 7 teams have entered this challenge.

šŸŒŸ What's the coolest way to travel across the city?

Using datasets which map urban heat and green cover across Greater Sydney, we challenge you to develop a tool which visualises green routes through the city. Help people avoid urban heat and move across the city in comfort by mapping out green streets and pathways which connect shopping centres, public transport stops and public spaces.

Go to Challenge | 18 teams have entered this challenge.

šŸŒŸ The three Cā€™s of innovation ā€“ combination, collaboration, and chance.

How can we combine and use environmental data to gain new insights into New South Wales and tell a story of our diverse landscape?

Go to Challenge | 14 teams have entered this challenge.

Leveraging innovation precincts to drive economic prosperity.

How might we build on interaction between businesses and research institutions in Australian innovation precincts, to boost business capability, growth, and job creation?

Go to Challenge | 23 teams have entered this challenge.