Waterwise

Project Info

Cicada thumbnail

Team Name


Cicada


Team Members


10 members with unpublished profiles.

Project Description


Problem

The water supply has been unstable across the years in Australia. Given the heavy reliance on rainfall,
focus on water conservation has been put on streamflow control.

However, things can be done more household basis. While water consumption remains consistently high, the visualizaton on the consumption per facility is missing.

Solution

We would like to introduce a mechanism that can encourage citizens to keep track of their water consumption,
while incorporating some social and gamification aspect so as to make water saving part of their daily life.
In this way, the small steps in water saving can be encouraged, in a fun way!

The details of solution is below:

Data analytics dashboard

  • By different time span (daily / weekly / yearly)
  • Real time graphics
  • Indicator of the water consumption situation

Compare

  • Historical data comparison Recommendation
  • Identify which appliance / household activity consumes most water and recommend the users with water saving tips (e.g. reuse water)

Social

  • Ranking among the neighborhood (for water saving %)

Alert

  • Send push message to users on app/email to remind that the water usage is touching the target boundary

Incentive

  • The collected points (drops) can be used for gift redemption

Data Story


Why DROP?

When we look at the current water situation in Australia, we could see a large area of arid inland, inter-regional water imbalance, unstable accessible water volume and increasing water demand.


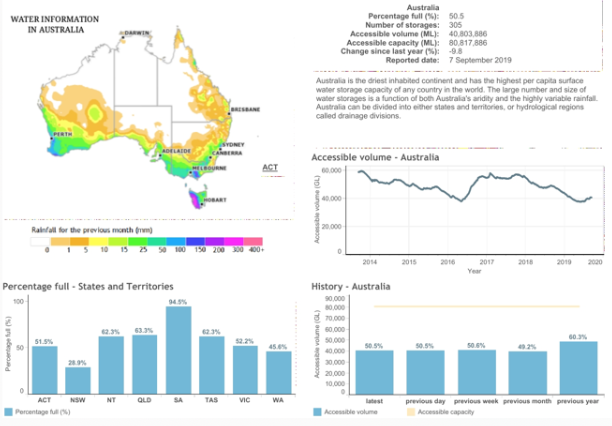
[Reference]: http://www.bom.gov.au/water/dashboards/#/water-storages/summary/state

Let's focus deeper on Melbourne Water situation.

The picture below shows the water storage and precipitation at four major dams in Melbourne.
On one hand, water supply comes from water storage in dams. There are two sources of water storage. One is from rain fall, which is the upper part of the picture. The other source is from streamflow, which is shown in the lower chart. However, we notice that both rain fall and streamflow experience high unstability over years. Dry year and wet year take place by turn.On the other hand, Water demand, which is drawn out in grey line in the lower chart, clearly shows an increasing trend year by year. From year 2007, water usage is surging.

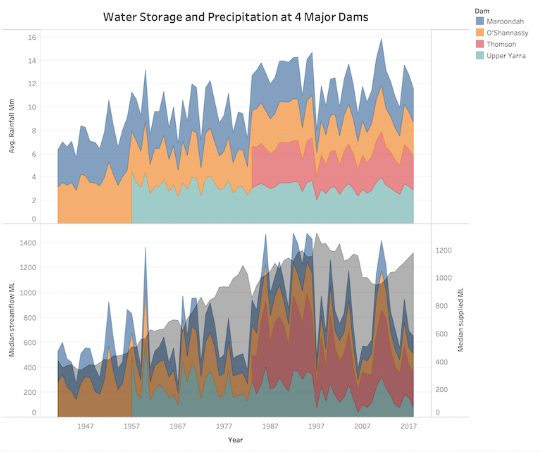
As a result, we can't count on a changing water supply, the only thing we could do is lower water demand. By developing DROP, a water saving APP that helps to plan home water usage, we hope to raise awareness from each individual to save water. We believe EVERY DROP COUNTS.


Evidence of Work

Video

Homepage

Project Image

Team DataSets

Observed Daily Rainfall (at the 4 Major Harvesting Storage Dams)

Description of Use Firstly, we calculate the average rainfall volume of each year from 1947 to March 2019. It's obvious the average yearly rainfall fluctuates. The highest rainfall volume is 15.8mm in 2011, and then it begins to decline. Our conclusion is that the water storage is unstable.

Data Set

Observed Daily Water Storage Dam Volumes operated by Melbourne Water

Description of Use We use the median of water storage volume of each year from 1947 to March 2019, and we find it is very unstable. Although the water storage volume is quite high during 1987 to 2012, the volume in recent years is less than resident usage consumption. Our conclusion is the water storage is unstable.

Data Set

Total Daily Water Volume Supplied by Melbourne Water

Description of Use After analyzing the dataset, we find that the Total Daily Water Volume Supplied by Melbourne Water gradually increases as time passes, from 1947 to March 2019. Therefore, it shows that the resident water volume consumption also increases. Saving water is an urgent issue.

Data Set

Challenge Entries

Public Transport for the Future

How might we combine data with modern technologies - such as AI/ML, IoT, Analytics or Natural Language interfaces - to better our public transport services. Outcomes could take the form of new commuter experiences, reduced environmental impact, or helping plan for the future.

Go to Challenge | 45 teams have entered this challenge.

Helping Start-ups and New Small Businesses in Australia

Choose one of the following questions to address: 1. What trends in business activity can help encourage self-employment through NEIS? 2. What type of NEIS businesses are being started and are successful (participated in the full 12 months of NEIS Assistance) and what can we learn from broader industry growth areas? 3. How do we encourage self-employment through greater participation in NEIS for cohorts currently underrepresented?

Go to Challenge | 21 teams have entered this challenge.

Waterwise

How can we protect and preserve our water resources?

Go to Challenge | 22 teams have entered this challenge.

Innovative ways to be efficient with water

Innovative ideas about water efficiency. Climate change means that we will have more unpredictable weather. Some of Australia is in drought and some areas have plenty of water. That changes each year. Water efficiency was a focus around the millennium drought. We want new, innovative and untapped ideas on ways to be efficient with water use. These ideas could include how we use water, how we can save water, how we waste water, how everyone can make a difference in using water wisely, water rules and ideas on saving water for the future.

Go to Challenge | 26 teams have entered this challenge.

Optimise energy and water resource planning

Optimise energy and water resource planning

Go to Challenge | 32 teams have entered this challenge.