Data Story
Climate change has been declared as "a threat to human well-being and planetary health", and much of this impact is due to the emissions from burning fossil fuels. Freight transportation alone is responsible for 8% of global greenhouse gas emissions.
Hydrogen is an alternative fuel source that can be generated using renewable energy. Australia is planning significant investment as a means to reduce emissions, the Australian government's State of Hydrogen 2022 report states that Australian hydrogen projects have "$230-300 billion of potential investment. This represents close to 40% of all global clean hydrogen project announcements".
Freight transportation is predicted to adopt hydrogen fuel over other sources. Mckinsey predicts the hydrogen refuelling market is set to increase 105% per annum by 2035, where "95 percent of [hydrogen] demand by volume will come from commercial vehicles".
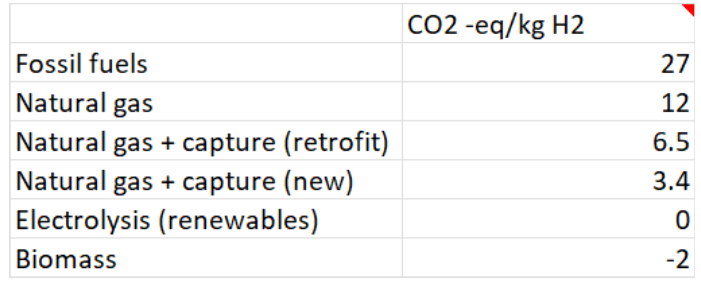
Hydrogen adoption does not guarantee emissions reduction, only 2% of global hydrogen production is using renewable sources. A 2023 report from the International Energy Agency outlines the CO2 generated from different sources, summarised below:

Our demand for commodities is growing. The NSW Government predicts Sydney commodity demand will increase by 96% by 2056, due to population increase, trends in household income, and industrial production. This will result in increased freight fleets, and therefore increased emissions from those fleets.
In our project, we have created a web application that allows decision-makers to explore:
- Are emission reductions from hydrogen adoption outpacing our increased demand for commodities?
- How can we compare different freight transportation types on their emissions?
- Where should we focus our emissions reduction effort?
Users can adjust hydrogen adoption, hydrogen generation, fleet demand, and commodity demand. They can then see how this impacts overall fleet metrics, including carbon emissions. The year can be selected to populate inputs with forecasted data according to publicly available data sources, and use this as a baseline to see whether we are on track in our emissions reductions target.
The application also allows users to investigate individual freight routes. They are visualised using freight vehicle congestion data and national key freight routes map, and can be inspected using natural language powered by generative artificial intelligence.
Future additions to this project would allow users to explore how different routes would impact fleet metrics, and expand the number of metrics to include other factors, such as cost.


